The ClorSensoud program
Reading data from serial is pretty fun but relatively unproductive. Don’t worry, everything is planned; you must install and use the ClorSensoud program. For this purpose, you just need a computer running all the time; in other words, a server. A good idea is to use a micro-server like Raspberry Pi or OLinuXino which are so geeky and very low power consumers.
Attention
You should be comfortable with GNU/Linux as we will not detail the operating system installation. In the following, we assume that a Debian GNU/Linux distribution is installed on the server, which is accessible via a SSH connection.
Install pre-requisite dependencies
Before ClorSensoud, it is necessary to install some pieces of software:
sudo apt install python3-serial python3-matplotlib sqlite3
Thus, it is possible to install and use main features of ClorSensoud.
Note
In order to be able to use the web interface, it will be necessary to do some bit more. It is detailed on Use the web interface section.
Install the ClorSensoud program
Just download the archive:
wget -O clorsensoud.tar.gz https://gitea.klirit.tk/Cypouz/ClorSensoud/archive/master.tar.gz
And uncompress it wherever you want:
tar xzvf clorsensoud.tar.gz && rm clorsensoud.tar.gz
Configure the program
Move into the program directory:
cd clorsensoud
Duplicate sample configuration file:
cp variables.default.py variables.py
Edit the configuration file:
vim variables.py
Change DIR_PROGRAM and SERIAL_PORT according to your system:
DIR_PROGRAM = '/home/USER/clorsensoud'
SERIAL_PORT = 'dev/ttyUSB0'
Where USER is your actual non-superuser user.
Note
It’s a really simplistic example. It would be a best idea to install the software in a non user-specific directory (/opt/clorsensoud, for example) and/or to create a clorsensoud dedicated user.
Try a data acquisition
Theorically, it would be possible to try a data acquisition. For that, just run this simple command:
./acquisition.py
The process log would be live displayed in the terminal:
┌─ Acquire data: 2018-07-24 17:19:04.061697
├─ Last data: 11.75, 39.37, 27.62
├─ Trend definition
├─ Trend: Clear
├─ Create directory /home/USER/clorsensoud/data/
├─ Insert data to database
├─ Add last data to data files
└─ Plot graph
Yay, it rocks!
You can check that Last data and Trend fields seem consistent, and that the data directory has been automatically created.
Automate data acquisition
Okay. So, everything seems pretty fine. Let’s automate data acquisition!
Nothing very cryptic, it’s just a cron. Edit the user crontab:
crontab -e
And paste this line:
* * * * * /home/USER/clorsensoud/acquisition.py > /home/USER/clorsensoud/data/log
Which ask for a data acquisition every minute, and save the last process log in a file. And where USER is the same as above.
What contains the data directory
The data directory contains some files:
ls data/
Should returns:
data_bw.txt data.db data_last.txt graph.png log
- data.db
- The SQLite main database which contains all data.
- data_last.txt
Just contains last data, one field a line:
2018-07-24 17:19
2.77
35.87
28.32
25.55
Clear
0
Lines description, from top:
- Date and time, expressed in the system timezone;
- Sky temperature;
- Sensor temperature;
- Ambient temperature;
- Sky and ambient temperature difference;
- Corresponding trend;
- An alarm flag which is
1when overcast,0when not.
- data_bw.txt
- Contains more or less the same fields as
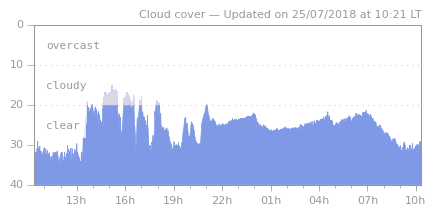
data_last.txt, in a oneline format. It respects Boltwood cloud sensor data format in order to able external programs which know it to use ClorSensoud as well. - graph.png
A graph of last 24 hours data. Looks like:
- log
- The last process log, as seen above.